A vital key to successful investing is to “Buy Low and Sell High.” However, predicting when the market will go up or down is difficult even for the experts. The truth is, it is nearly impossible for any investor to accurately “time the market.”
But that does not mean, as an investor, you should stay away from the markets. One useful strategy you can adopt to avoid the problem of guessing the right time to enter the market is dollar cost averaging.
What is Dollar Cost Averaging?
Dollar cost averaging is an investment strategy that involves putting a fixed amount of money into an investment (i.e. mutual fund or specific stock) on a regular basis, regardless of market conditions. This strategy usually allows an investor to take advantage of market downturns and enjoy the benefit of lowering the average cost of their investments over time. However, it does not guarantee a profit or protect against a loss.
How can it benefit your portfolio?
The unit price for your mutual fund or portfolio investment fluctuates over time. With dollar cost averaging, you generally invest the same amount of money each week, month, quarter (or at any interval you choose). This means that you buy more units or shares of an investment when the price goes down and fewer units or shares when the price goes up.
Advantages of Dollar Cost Averaging
Many investors employ the dollar cost averaging investment strategy for two main reasons:
- It is an attractive option for investors who find it easier to add to their investment in small sums rather than large lump sums.
- It eliminates having to predict and time the market’s directions. By using this strategy, an investor’s overall returns will be determined by the overall trend in a given investment rather than investor’s specific entry price.
How regularly scheduled investing can improve your average investment cost*
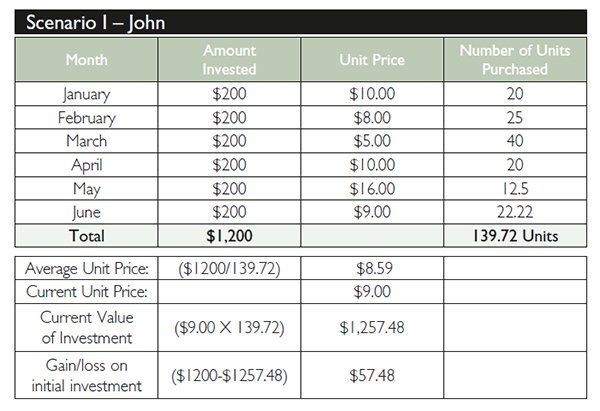
Let’s say John invests $200 into a mutual fund every month for six months. The unit price is up some months and down in others. The table below shows how John uses dollar cost averaging to benefit from the market’s volatility over this period and grow his investments.
Now assume Sally invests in the same mutual fund but places her $1,200 as a lump sum investment in January. She makes no other additional investments or withdrawals from her mutual fund for the next five months and, therefore, does not take advantage of the declines in the price. The table below shows how Sally would have fared over this same period.
As you can see in these scenarios, for the same total investment of $1,200, John is better off than Sally by the end of the investment period. While Sally’s overall investment reflects a loss of $120, John’s investments reflect a profit of $57.48. This is despite the fact that the unit price for the investment has declined from $10.00 to $9.00 over the period. In addition, at the end of six months, John has purchased more units for a lower average price per unit and his overall investment value is greater than Sally’s.
* For illustration purposes only.
Investment Planning Counsel


